平成28年2月22日 (Feb 22, 2016)
|
|
ノモグラムとは、
平行に並んだ軸に目盛りを打って、
それに定規などの直線を交わらせることで加減算(線形変換)ができる、
という原理で様々な計算ができるよう作られた図である(狭義には)。
乗除算は対数変換で加減算になるので、目盛りの数字を対数で打てば、たとえば
Nomogram is a chart
that consists of three or more parallel lines as axes with tics,
and that makes us enable to compute addition and subtraction
(linear transformation).
Multiplication and division are transformed into addition and subtraction by
logarithms, therefore, for example, the nomogram can be made that computes
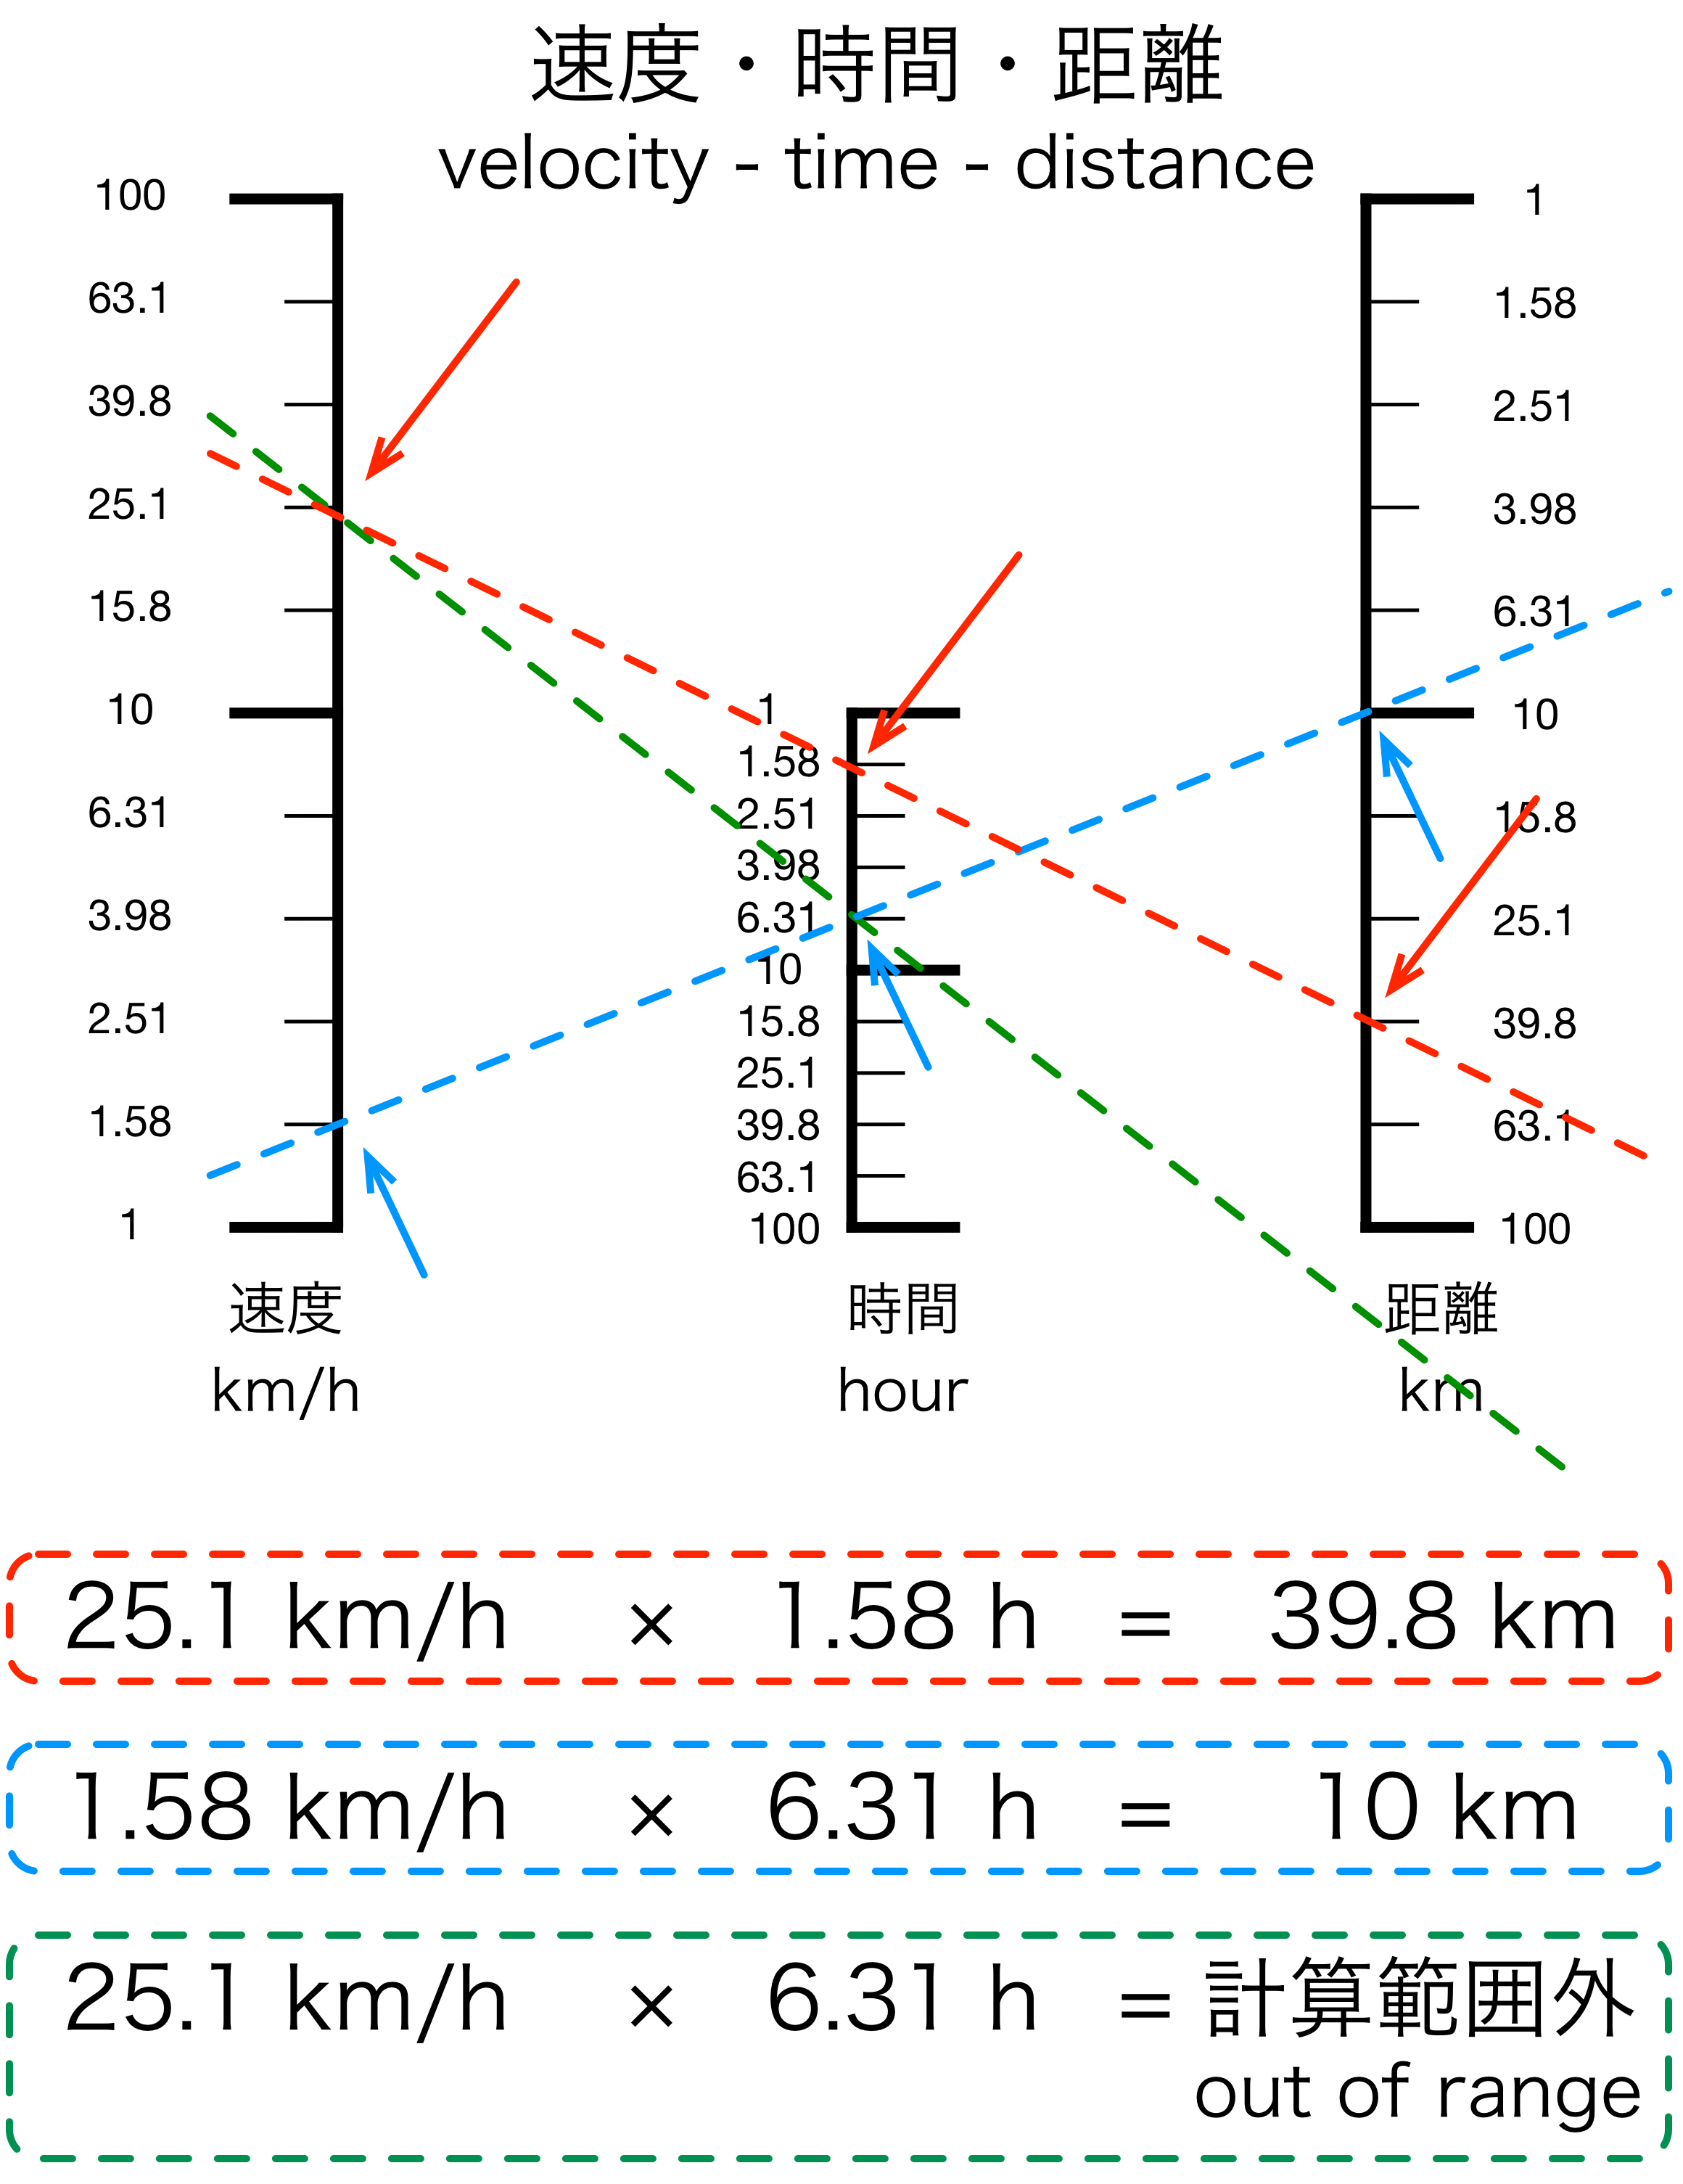
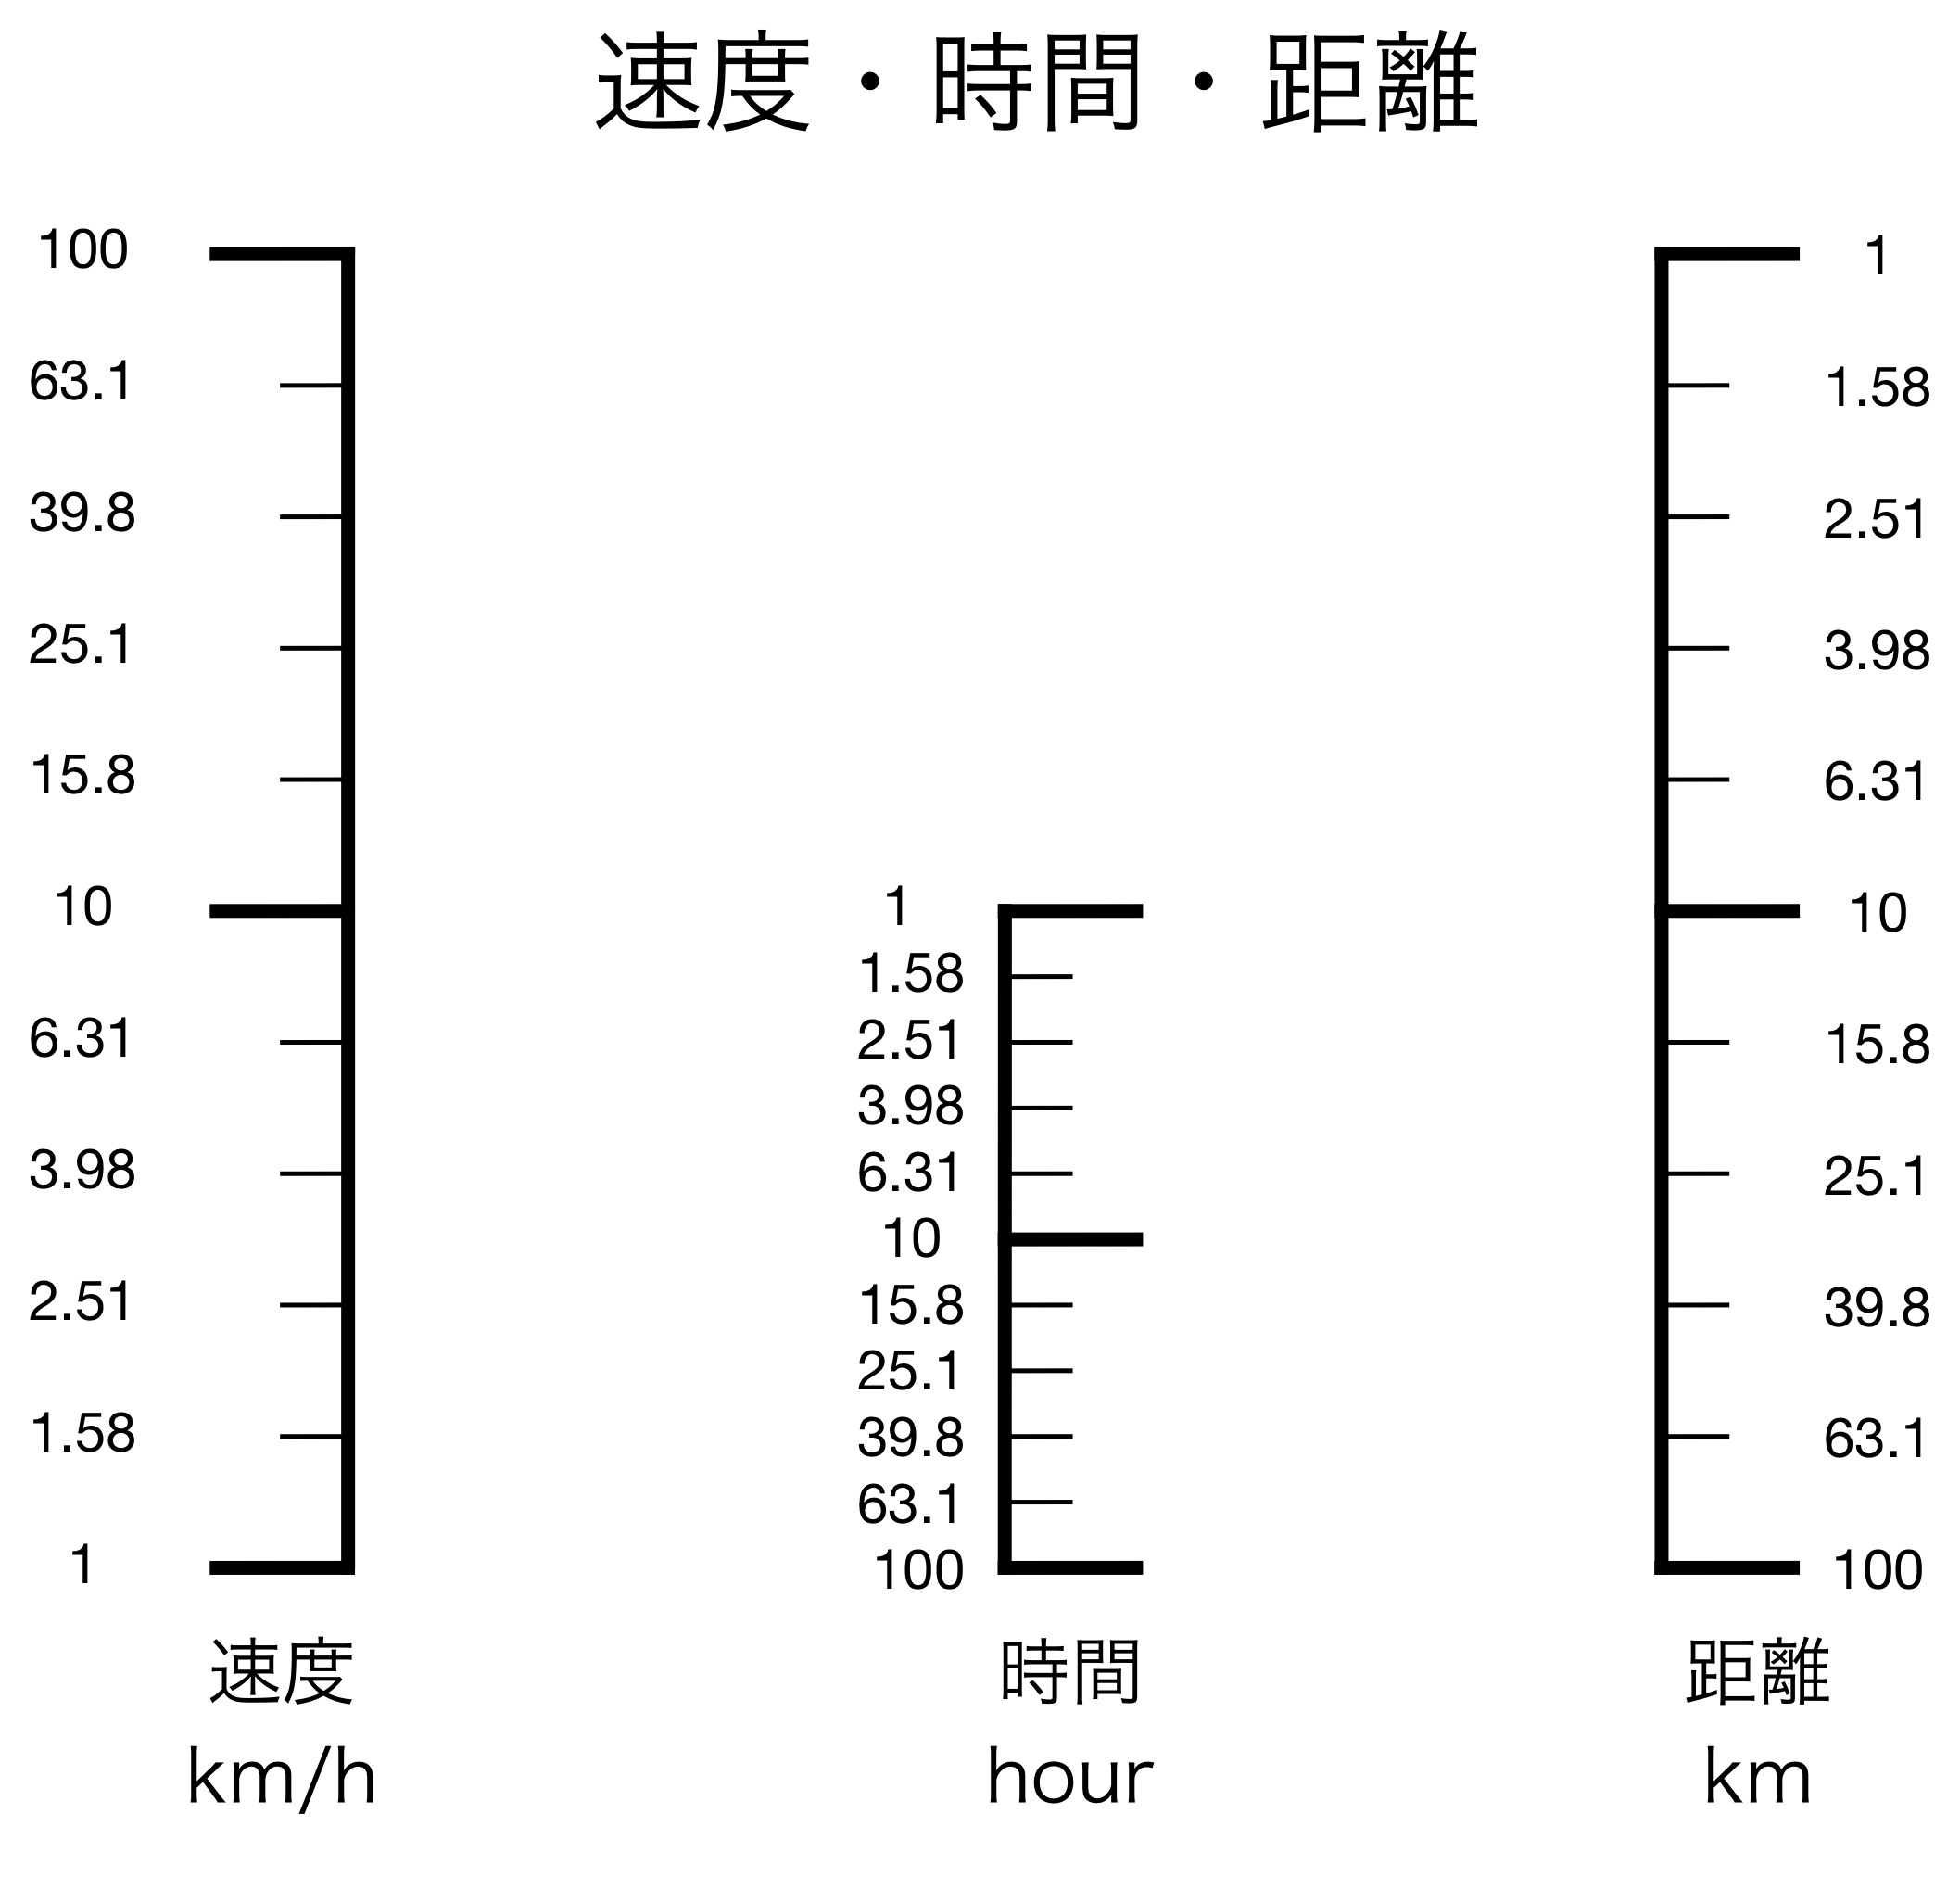
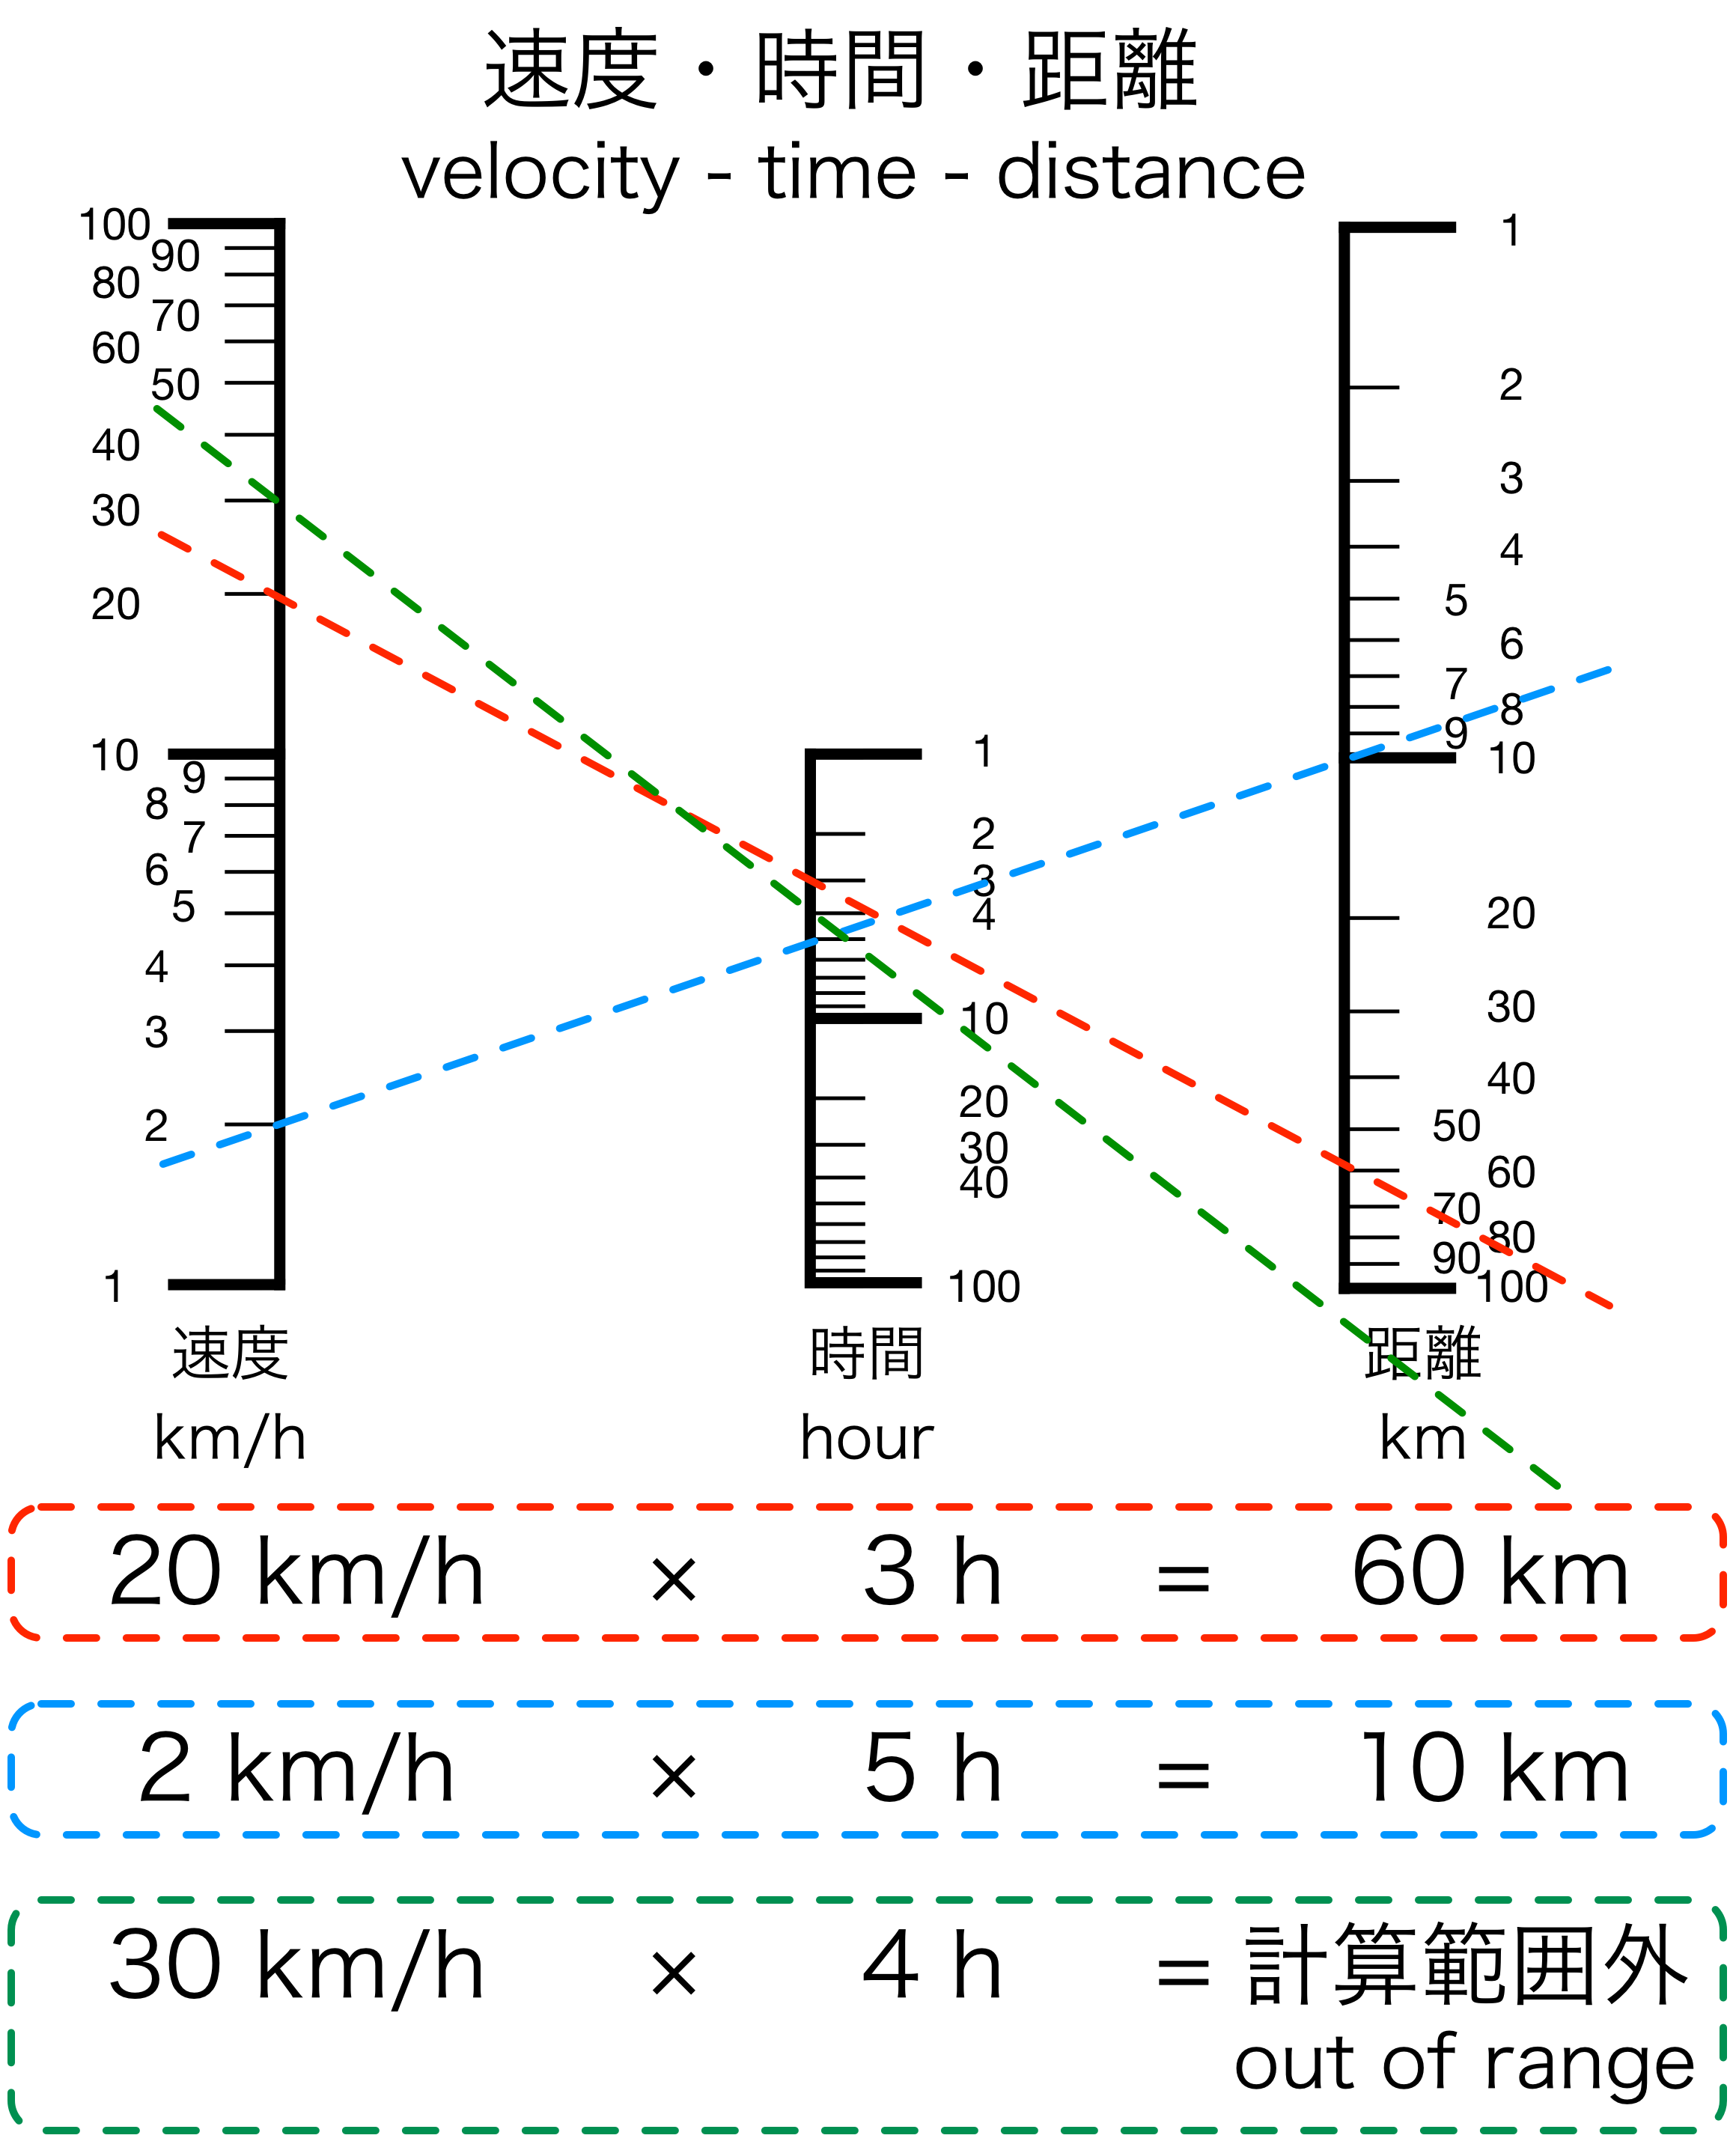
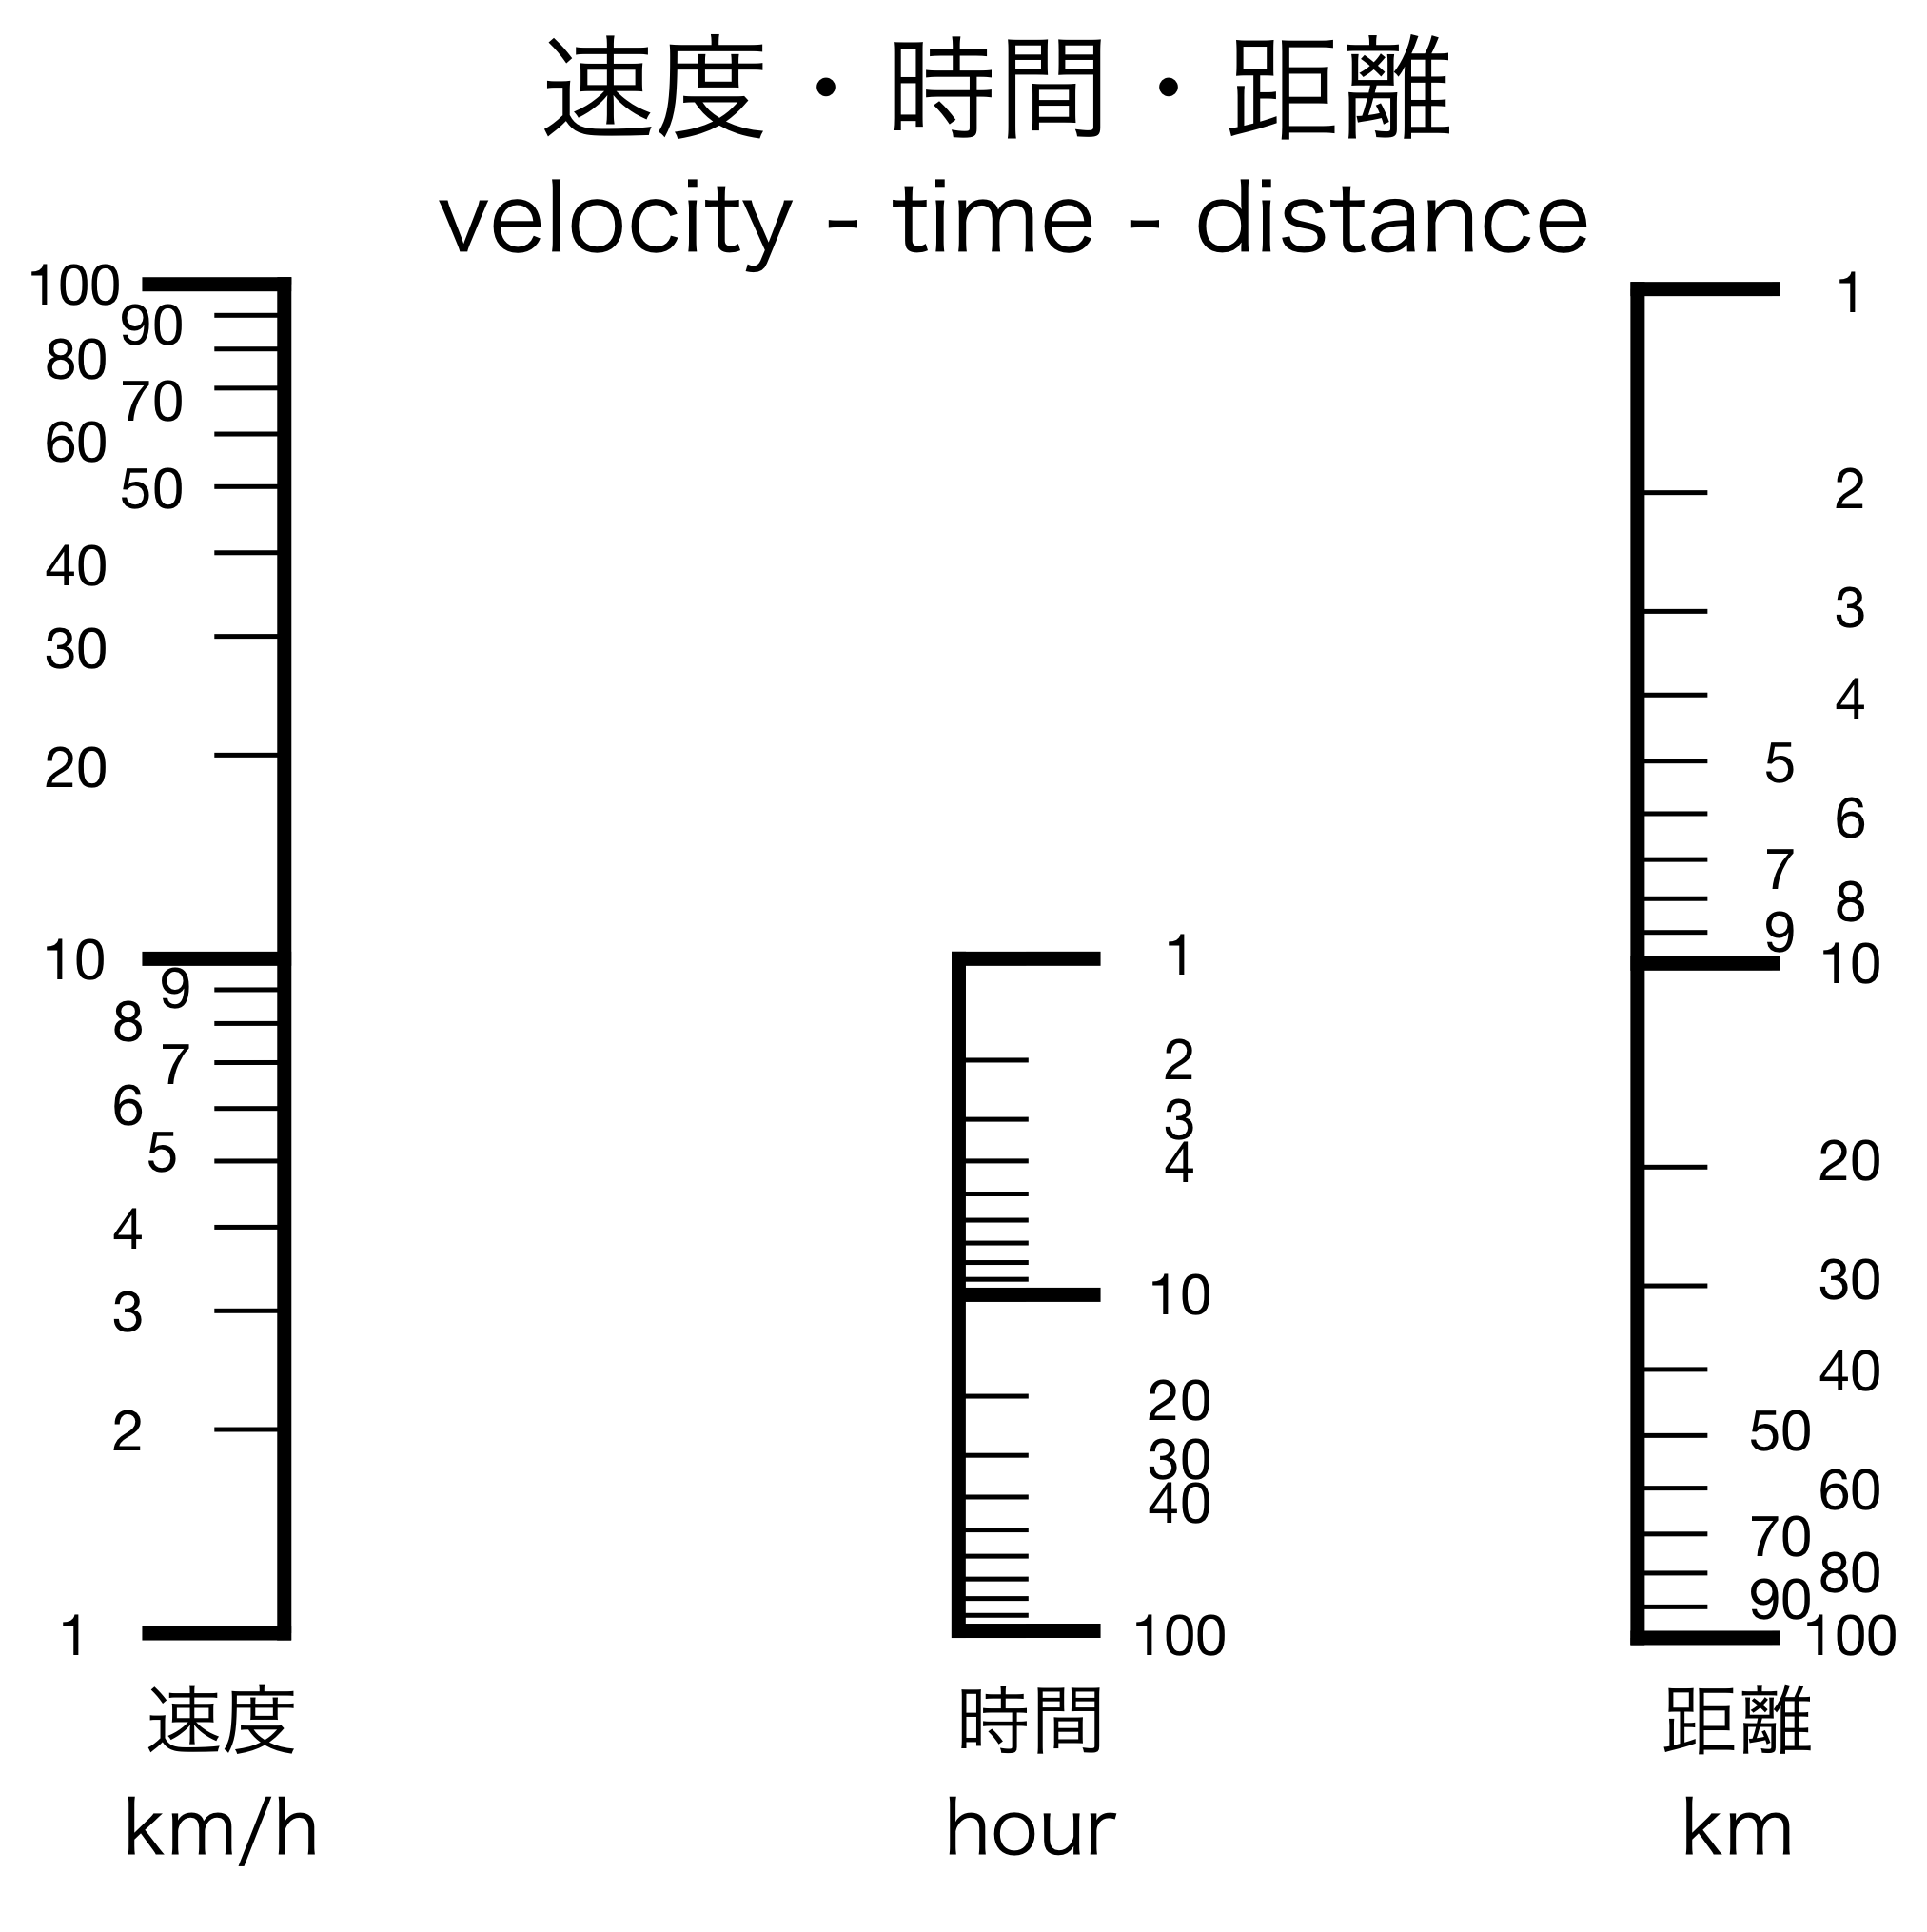
距離 = 速さ × 時間
Distance = velocity × time.
という計算をするノモグラムを作ることができる。
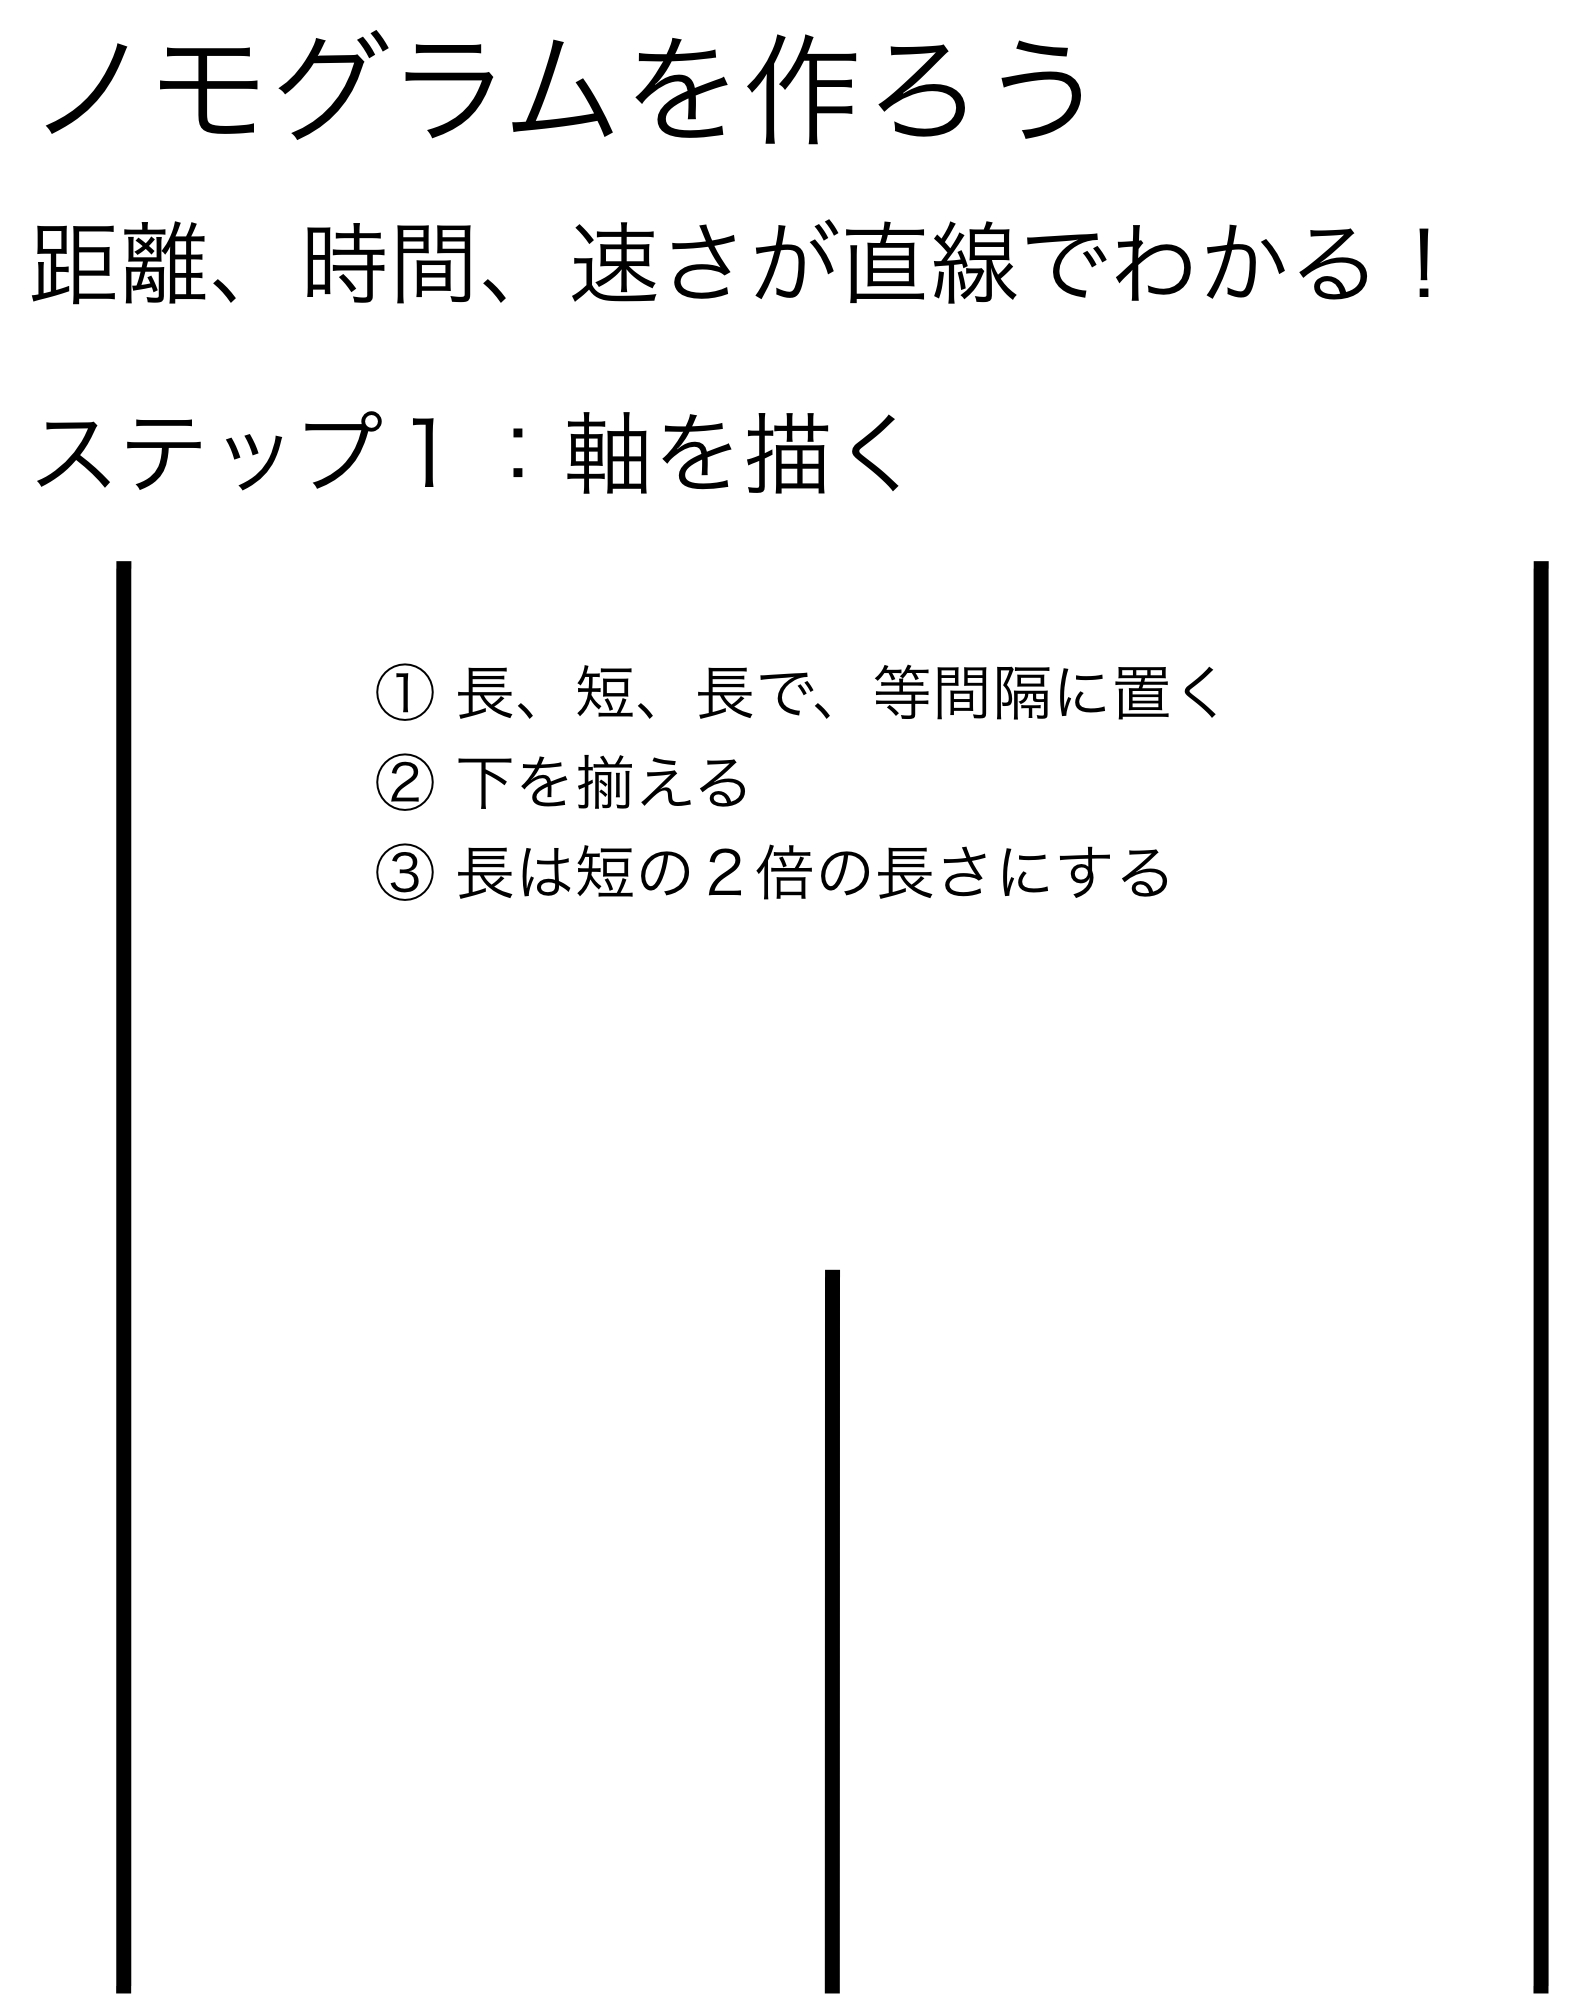
というわけで、作ってみよう。
以下は、速さも時間も距離も 1 から 100 までの範囲のものを作る手順である
(対数変換に基づくから、範囲全体が正の数でなければならない)。
精度を高くしたい時は、もちろん図を大きくして目盛りを多くすればいいが、
まずは線を細くするといいかもしれない。
図はクリックすると大きくなるよ!
Here, let's make it!
Following pictures indicate how to draw the nomogram in which
the limits are 1 to 100 for each all variables (distance, velocity, and time.
ranges can not include zero or minus bacause the chart is based on
log transformation).
Precision of the calculation depends on the number of tics
or how large the chart (larger chart can have more tics).
But the first thing you may try to make it precise is
use thin lines to draw the chart.
Click following pictures to enlarge.
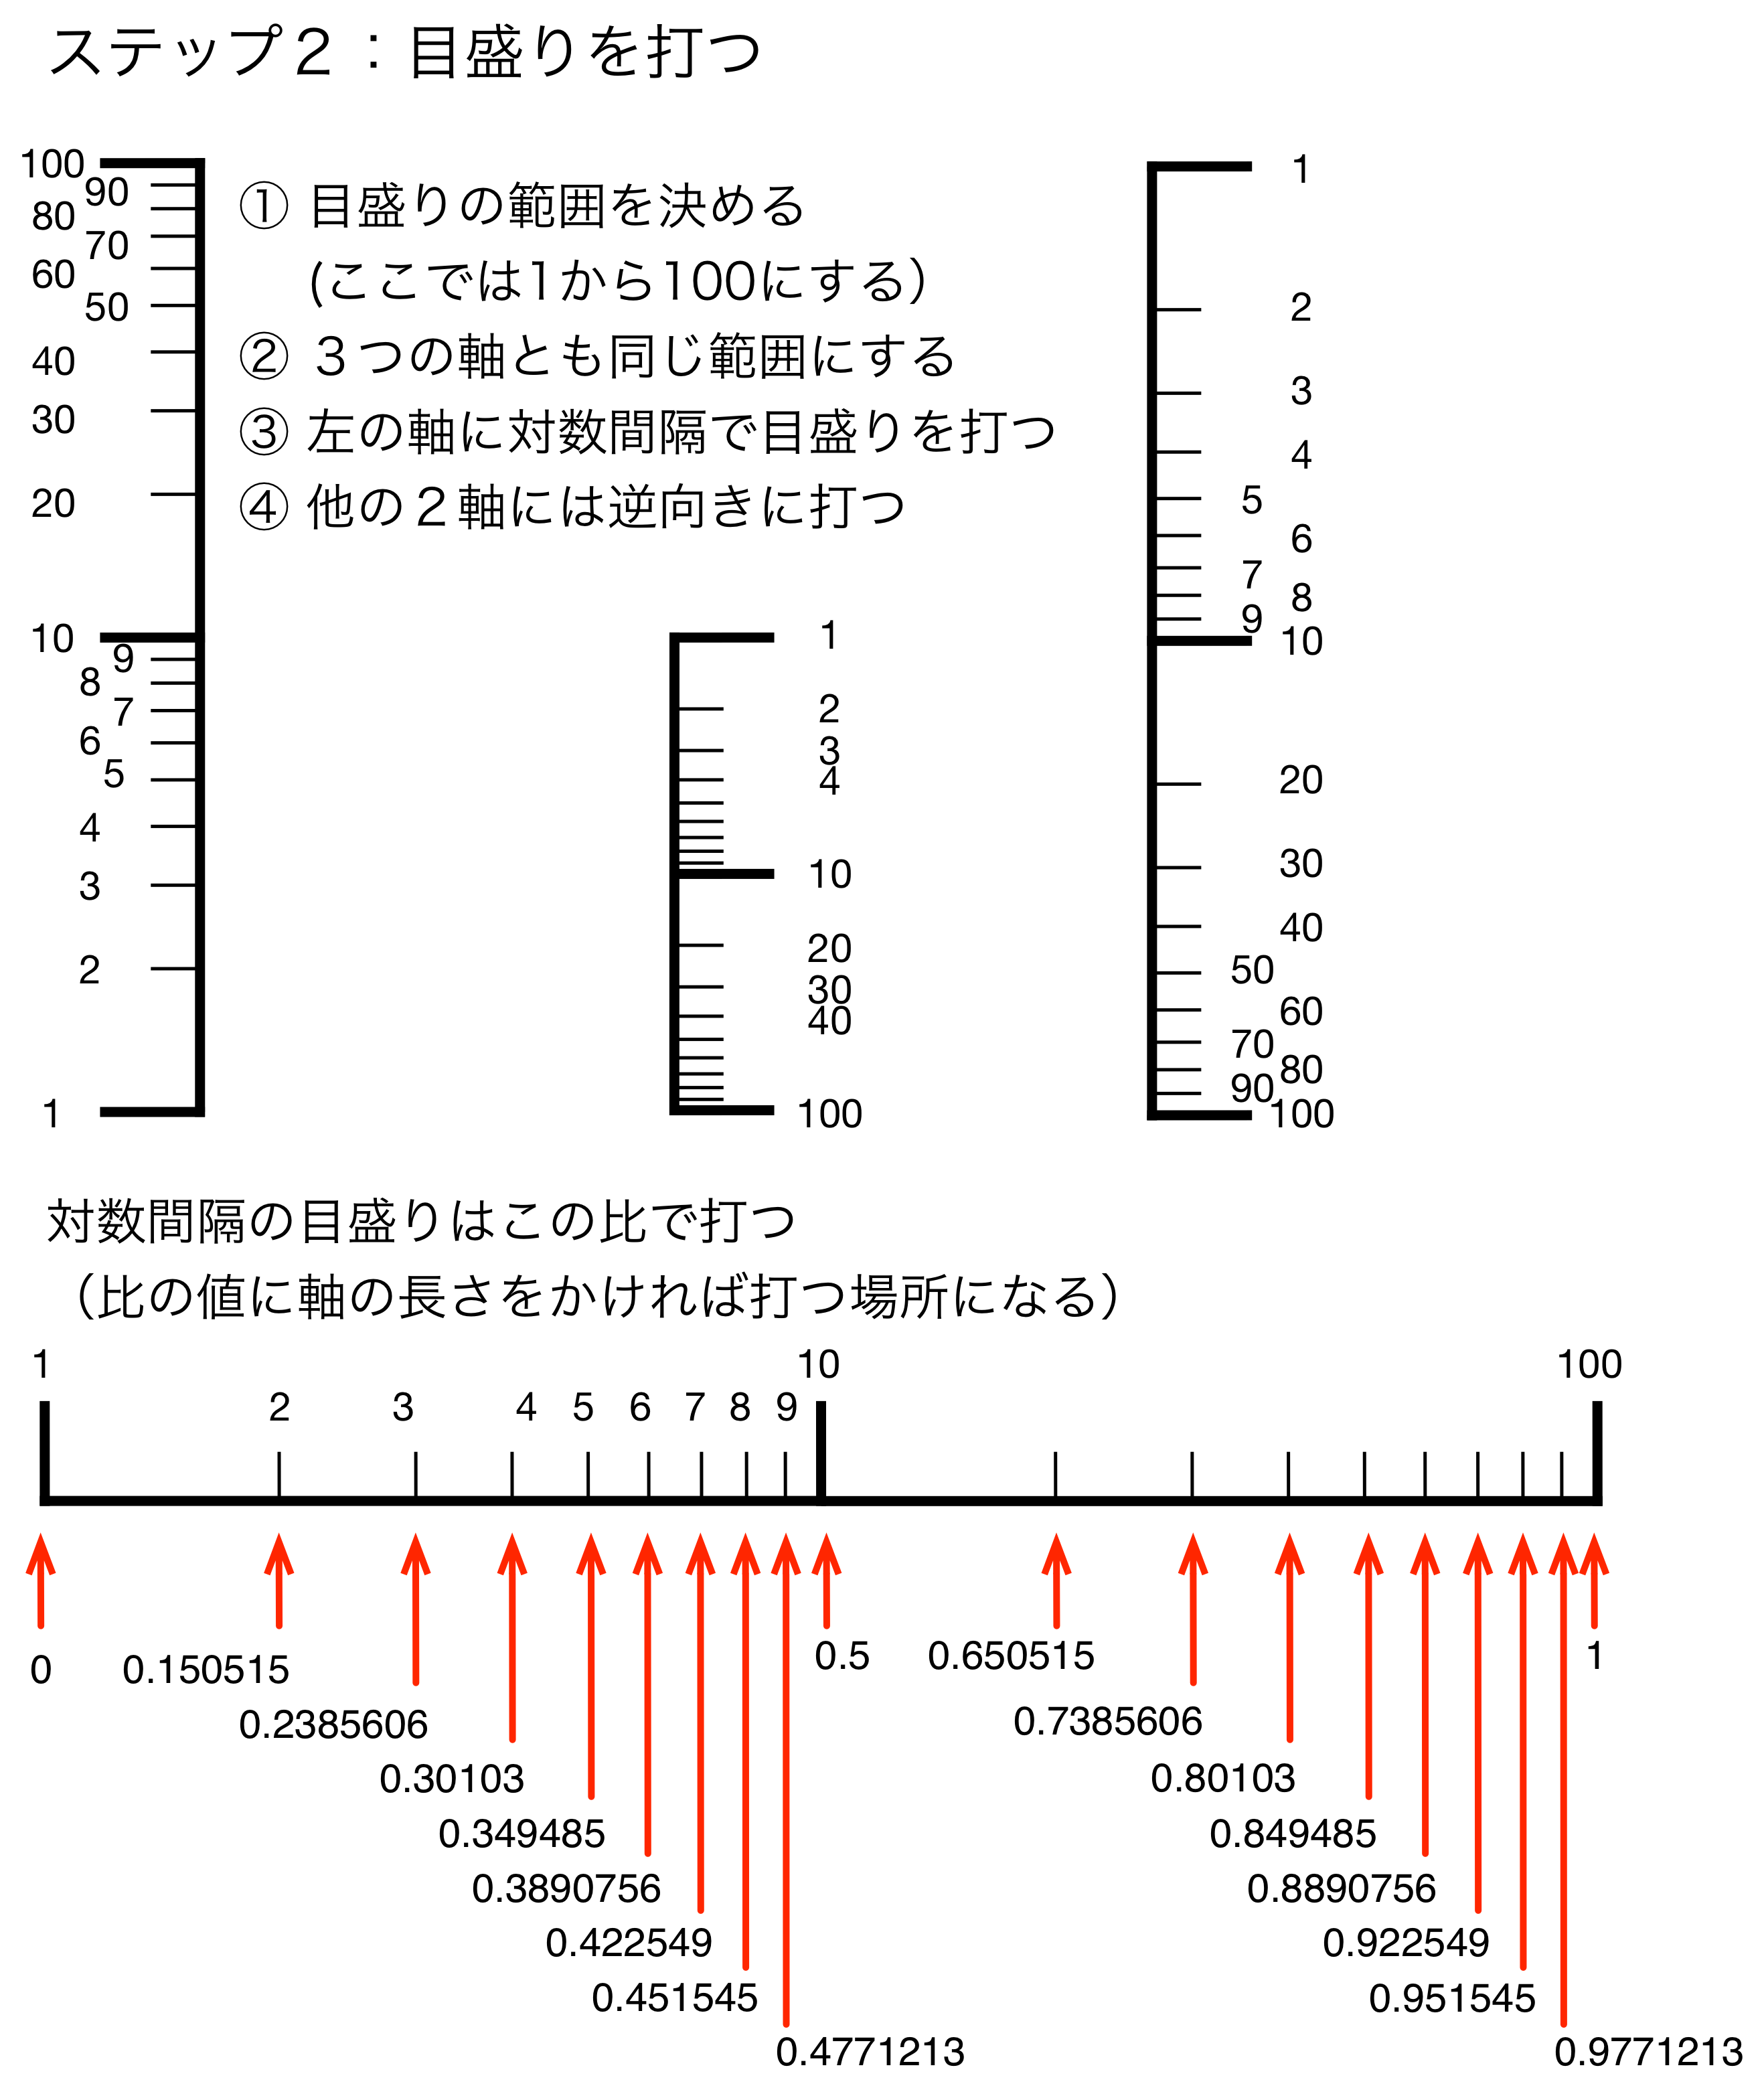
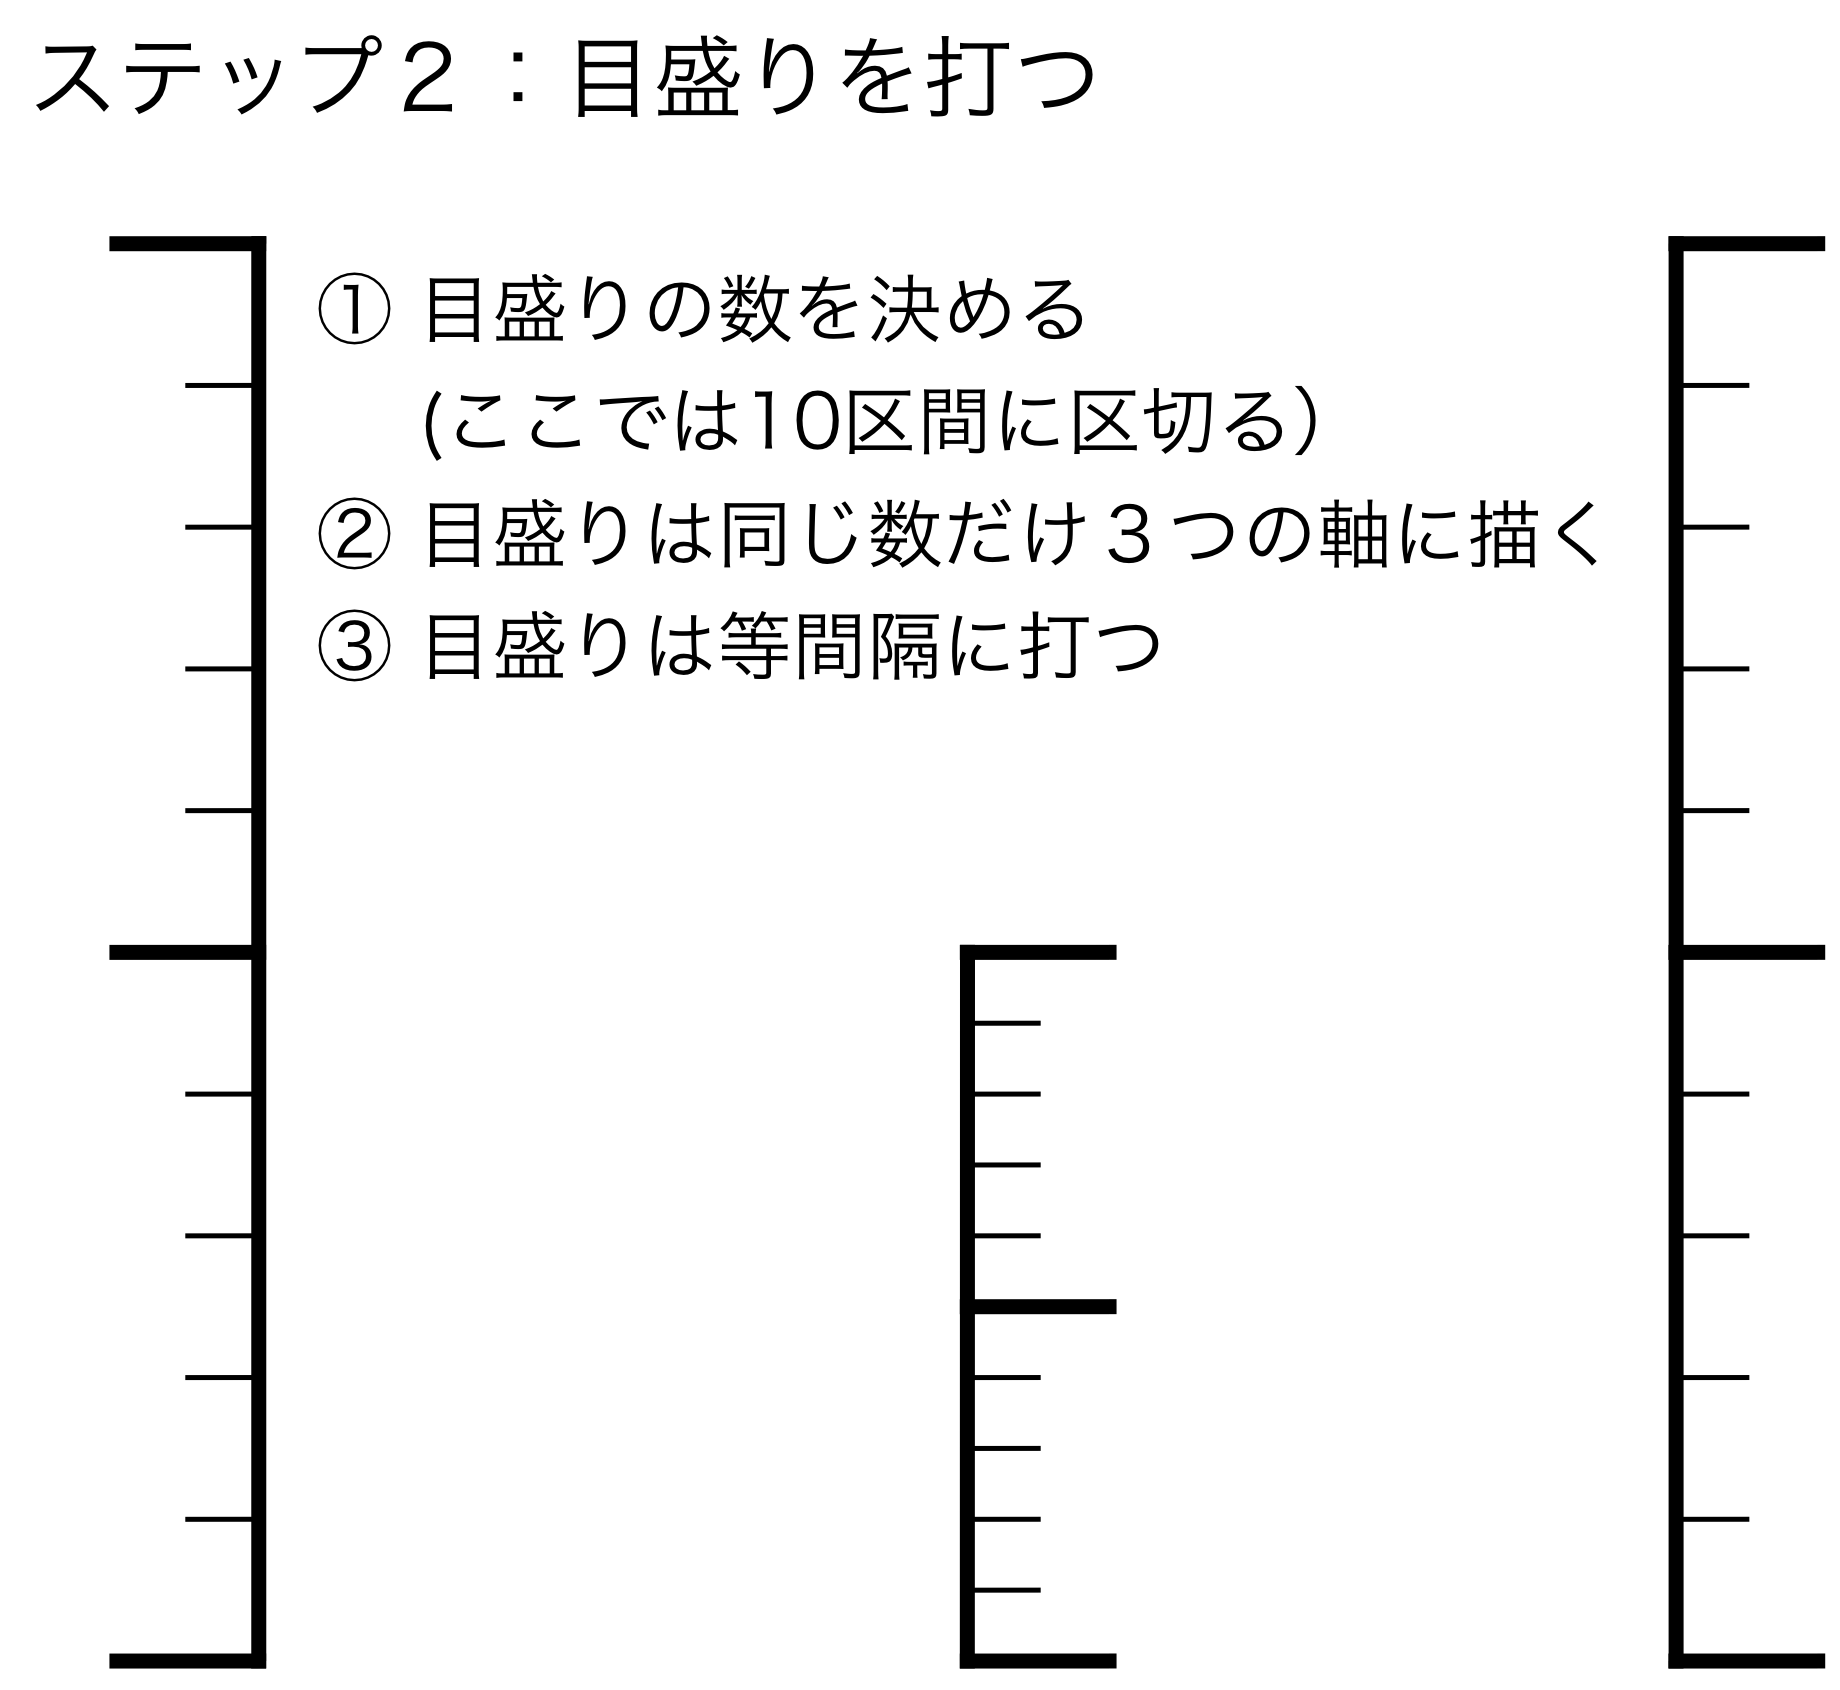
Step 2: Put tics.
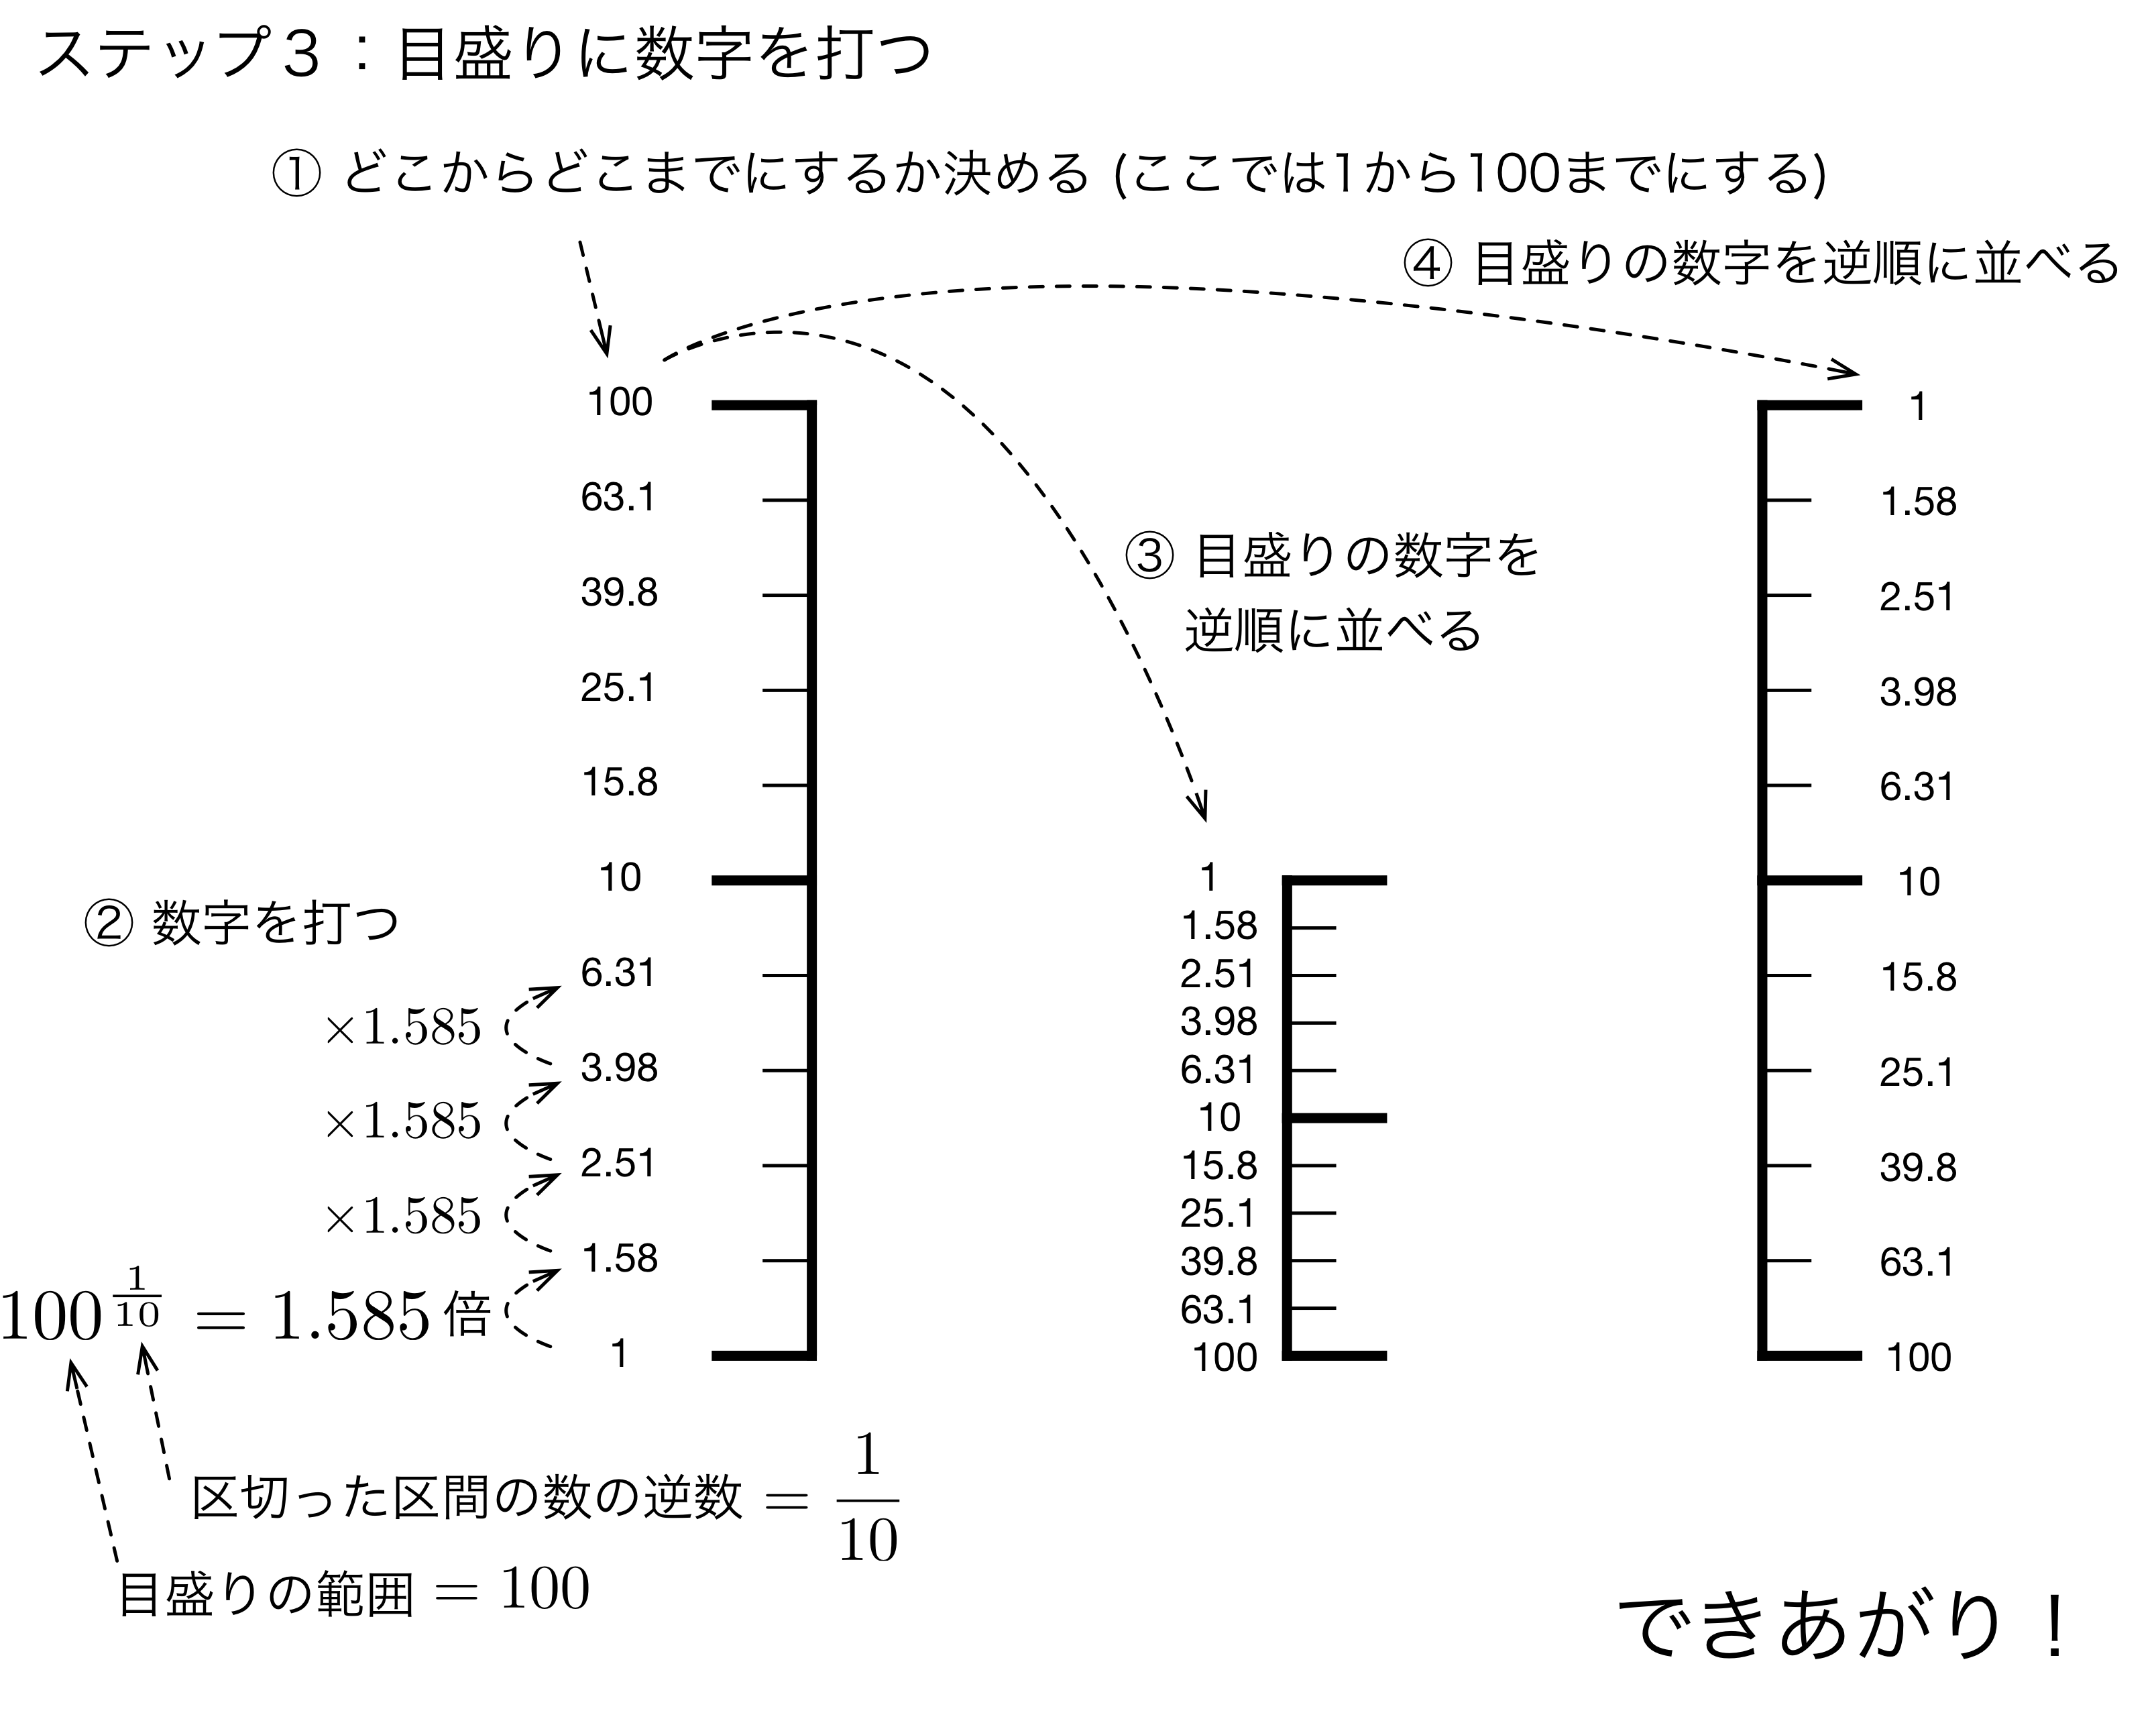
Step 3: Put numbers on tics.
Step 2: Put tics.